8 Key Points to Remember When Interpreting Data in a PhD Thesis
Quality data analysis forms the basis of any PhD thesis. To ensure your PhD work is original, you’re likely collecting lots of data to analyse and interpreting that data can easily trip up any PhD student. What’s more, there is plenty of pressure on you and your capability to address the posed research objectives and questions with your data.
Unfortunately, many students fail to succeed in completing their PhD due to some common mistakes in the data collection, data analysis and interpretation chapters. Even worse, your supervisor is probably not much help as they’re already too busy themselves! So trying to analyse your data without knowing how can make it really challenging.
Here are 8 key points to keep in mind when interpreting data in your PhD thesis writing to help you successfully analyse your data and finish your thesis.
Top Tips for Interpreting Data in Your PhD Thesis
1. Data Collection Design Is Crucial
Even the best data interpretation method can’t address problems of missing, inaccurate or biased data in PhD thesis writing. If you’re planning to work with statistical tools, make sure that you have a sufficient sample size, validate your data sets and run some basic significance tests such as Cronbach’s alpha.
2. Select the Right Instruments for Data Analysis
Even experienced students are prone to methodological mistakes. Such as using the Mann-Whitney test for comparing dependent data because this test is for independent data only. Or building linear regressions of mean values, when this tool is used to find the slope of the regression and a mean value isn’t suitable for this analysis.
There are lots of tools to analyse and interpret your data and finding the most suitable tool may be difficult if you are unfamiliar with them. If possible, consult with your tutor or a reliable PhD services agency to ensure that you are using the right tools for the job.
3. Prepare Your Data in Advance
Many researchers make the mistake of not revising their numeric datasets or database records prior to conducting statistical analyses. Try to convert all your information into a common format in advance to recognise any existing inconsistencies, missing respondent statements or unusual trends before it is too late to address these issues.
4. Analyse the Data Interpretation of Your Colleagues
If you are using a popular PhD research design or a widely applied statistical instrument, chances are you can easily find 5-10 published projects with similar methodological choices. Study these examples to gain some interesting ideas or learn about better data interpretation instruments and techniques you may have missed.
5. Question Your Assumptions
If you are working with qualitative data, your interpretations may be prone to various forms of researcher and respondent bias. Approach all your assumptions with caution and never exaggerate your findings or overstate their significance.
The same is true for the statements made by your respondents. If you are working with thematic analysis, for example, make sure that you only analyse the ‘quantitative’ factors such as code frequency. Your respondents may be biased or uninformed in some spheres, which is why basing your assumptions on a single interviewee statement is never a good idea.

6. Avoid Unwarranted Claims
Some doctoral dissertation research projects don’t produce ground-breaking results and there is nothing you can do to influence their outcomes. If your study confirms the assumptions based on the previous projects in this field, this still doesn’t detract from its significance or novelty. Remember that your responsibility as a researcher is to enlist the facts of your hard work and not make these facts sensational by distorting their objectivity or accuracy.
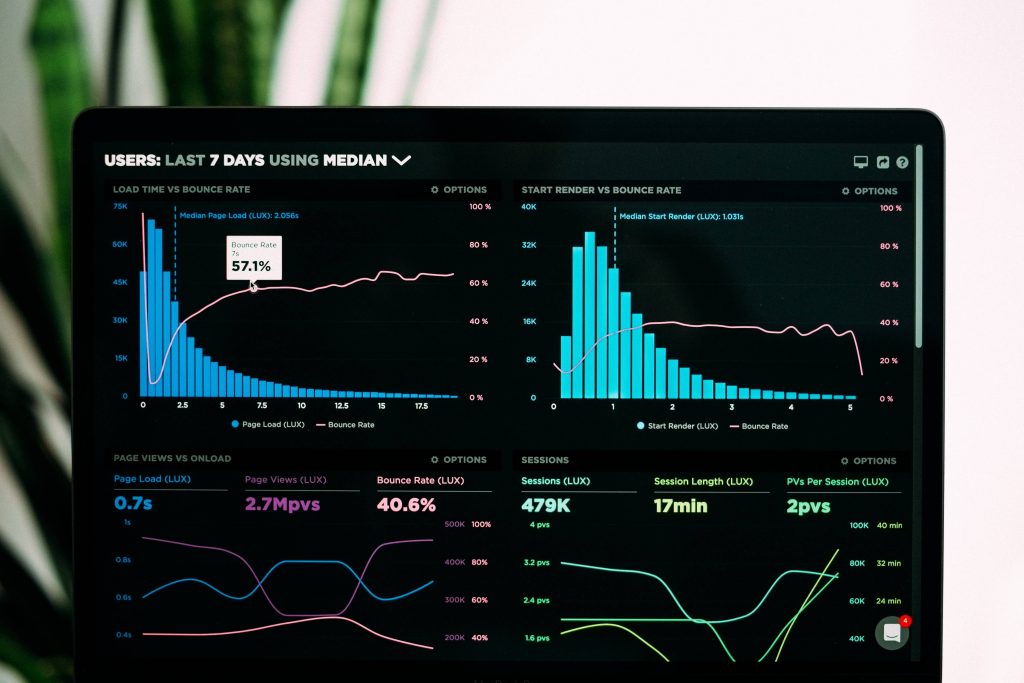
7. Use Graphical Analysis to Demonstrate Data Interpretation in your PhD Thesis
Besides the improved readability of your findings, data visualisation allows you to recognise some major problems or unusual trends within your findings. An instantly visible deviation on one of your graphs is much easier to note than several problematic lines within a large table. Most software packages including SPSS and NVivo allow you to build graphs with several clicks of your mouse. Try to produce these visuals after each analysis you perform to promptly identify any possible issues.
8. Have a Backup Plan
Things don’t always go as planned. If you encounter data quality problems, sample size issues or other unexpected factors reducing the statistical significance and statistical power of your findings, you may need to return to the data collection stage. Make sure that you always have a contingency plan for any emerging difficulties including personal ones. In some scenarios, it may be better to return to your analysis phase several times to improve its quality than to work with sub-optimal data and suffer the consequences.